Team
- Myself
Rogue Designer - Emily H
Analytics Lead
My Process
- Analytics & Analysis
- Secondary Research
- Synthesis
- Reporting
Results
- App fragmentation reduced 30%
- Increased visual consistency across touchpoints
- Contributed to org-wide transformation effort
The Opportunity
Optum’s business relied on the practice of acquiring existing businesses and systems, then folding them into the Optum portfolio. Sometimes these integrations gave little interruption to users, while other times new (duplicative) products were stood up as band-aids to keep back-end systems separate.

The result of a fast-moving business acquiring and relying on legacy technology resulted in fragmentation and inconsistency between products. Customer journeys traveled these disparate products with little to no transition or expectation setting.
New projects were always big and development teams often didn’t have the psychological safety or operational safety necessary to move quickly, efficiently.
Our numbers seemed to reflect this technological inefficiency. Tech accounted for 30% of spending, but had yet to deliver an adequate ‘self service’ experience to users. ORx spent north of $40M annually on technology development, yet still required massive customer service resources to field an endless cascade of customer experience issues.
“[Optum’s] PBM cost to serve (CTS) is not competitive relative to current market pricing and includes costs that are not effectively priced into existing contracts.”
AT Kearney
OptumRx had a competitive advantage because we were the only company offering a single, synchronized solution across Rx needs. However, the market was changing quickly and recent negotiations made with enterprise customers had collectively increased pressure on OptumRx to improve the business. The current state was that processes and technologies were inefficient and made it difficult for employees to do their jobs, which likely hurts the customer experience.
How not competitive? OptumRx filled over 58M scripts that year averaging ~$16+/Rx, doubling the market average ($8/Rx).
The Hunch
I had begun to get a glimpse into the disparate ecosystem of products presented to customers during my years connecting with product and design experts across the org.
Heuristically, fragmentation and inconsistency are likely to cause distrust and attrition, dropping customers at crucial junctions in their journeys like open enrollment, early registration and onboarding.

I had a feeling that this fragmentation could potentially be a significant contributor to both the service-level issues we faced, and the customer experience issues being voiced.
This presumed fragmentation of our omnichannel experience was broad, effectively capturing the entire breadth and depth of the Optum portfolio.
…And categorically outside the scope of my official responsibilities.
It was time for me to make some mischief.
The Approach
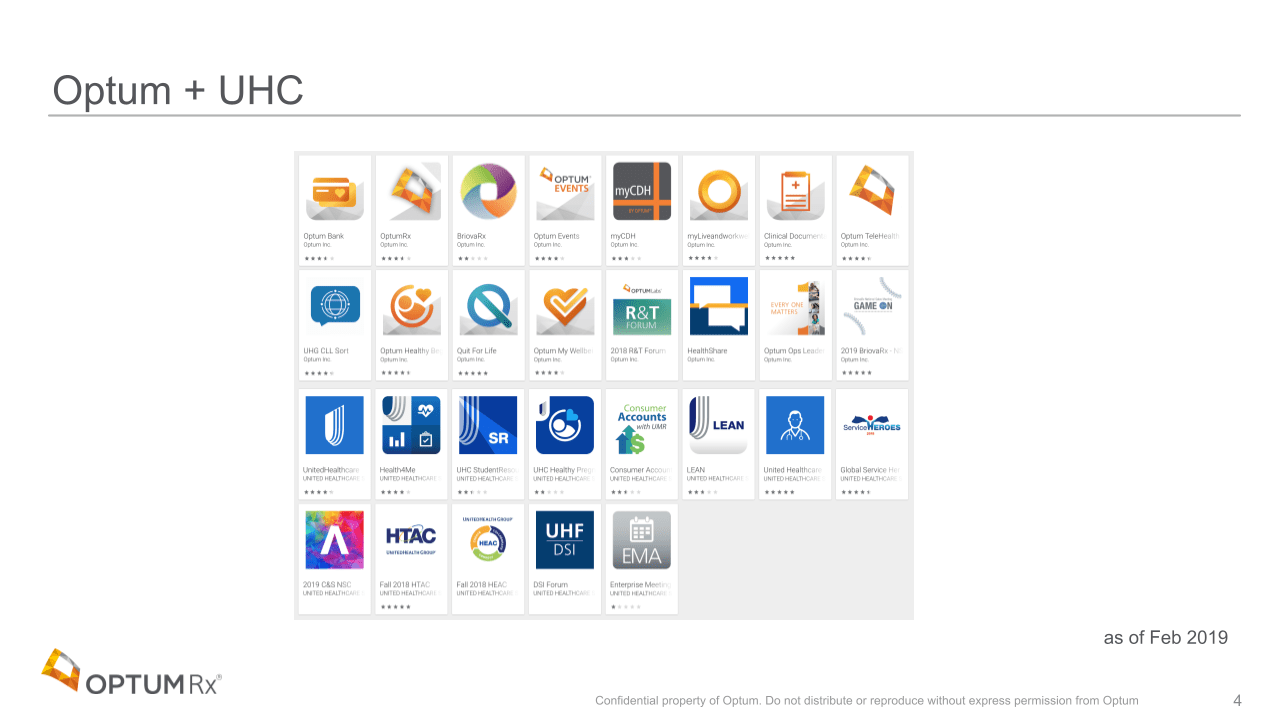
I began with light secondary research, intentionally ramping my efforts and starting with the easiest-to-find information. I was doing this ‘on my own time’ and couldn’t afford to spend time pursuing my hunch if it was incorrect to begin with. Initial investigation showed:
- Yes, Optum did indeed have a lot of publicly-available apps
- The visual aesthetic of the different products was inconsistent
- Our customers were increasing mobile usage, aligning with broader market trends
With this initial validation in-hand, I dug deeper into secondary market research and engaged the analytics team to help point me towards specific data sets and recommend any others. As the bigger picture began to take shape I synthesized my findings and recommendations into a deck that could be easily presented and shared.

As my deck materialized, I met with select OptumRx product leaders that I had particularly good relationships with one-on-one, asking them for feedback and input. After incorporating their recommendations, I socialized the deck with the wider org.
The Outcome
The picture this research painted was one not only of fragmentation, but also uncovered a previously unknown user behavior and, most crucially, an fundamental issue with how we rolled out new products and measured the success of our development teams.


To this day, the number of public-facing apps is 30% lower and visual consistency across touchpoints is greatly improved.
This presentation continued to make the rounds and eventually served as a driver and input (along with many others) toward a new organization-wide transformation effort. This transformation plan prioritized efficiency, reduction in tech debt, and seamless experiences for end-users. Later, AT Kearney estimated the total savings of a successful implementation of this plan at over $1.5B.
While I can no way take credit for the eventual plan or all the individual steps that were taken in its service, I am very grateful for the contributions I was able to make.